Developing Oregon’s Statewide Wildfire Hazard Map
Oregon State University researchers worked with the nation’s leading fire modeling and local subject matter experts to develop the Oregon Statewide Wildfire Hazard Map. The purpose of the map is to identify where wildfires pose the most hazard to structures and other human developments. Similar methods are being used across the nation to support strategic wildfire risk reduction programs. As a science-based tool, the wildfire hazard map and related data will help state agencies and individuals objectively prioritize risk mitigation actions in Oregon communities.
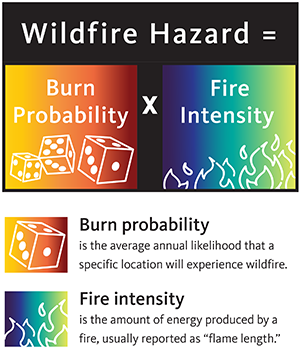
To create the wildfire hazard map, OSU researchers combined two primary datasets – burn probability and fire intensity. Both were modeled across Oregon using the best available data and with the help of state and local fire professionals. Burn probability and fire intensity are based on four criteria:
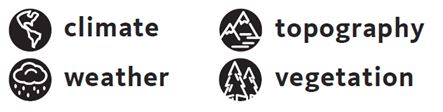
Data regarding these criteria were combined with data from historical fires and simulations of 10,000+ plausible fire seasons, accounting for fire likelihood and intensity under everything from mild to severe fire weather.
How Are Burn Probability and Fire Intensity Modeled?
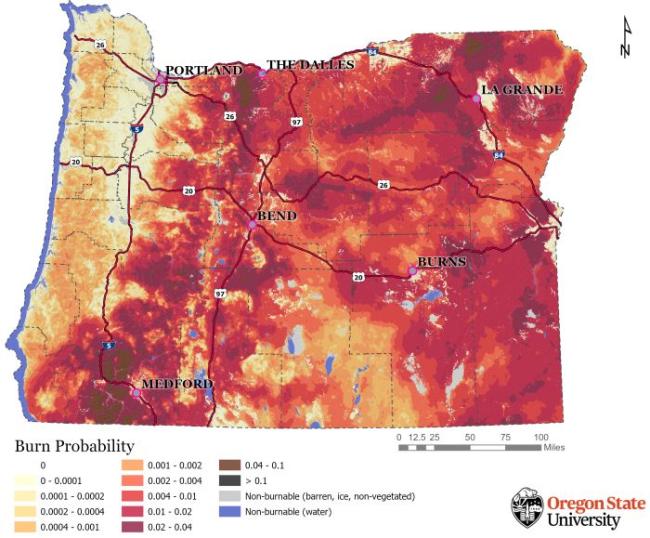
To model burn probability, data related to these criteria are combined with information about historical fire events in spatial fire models. Then, fire models run 10,000+ simulations of plausible fire seasons to capture the full range of possible fire activity, under everything from mild to severe fire weather.
Fire intensity is modeled using similar simulations that represent over 200 unique fire weather scenarios based on observed weather records. The fire intensity simulations capture the nuanced ways in which wind is affected by the landscape and the important changes in fire behavior as a result.
Average annual burn probability is an estimate of long-term average likelihood that a location will experience a wildfire. Burn probability is not a forecast or prediction of where wildfires will occur in a specific year. Burn probability values can be interpreted as percentages. For instance, a value of 0.01 is equivalent to a one percent chance that the location will experience a wildfire in any given year.
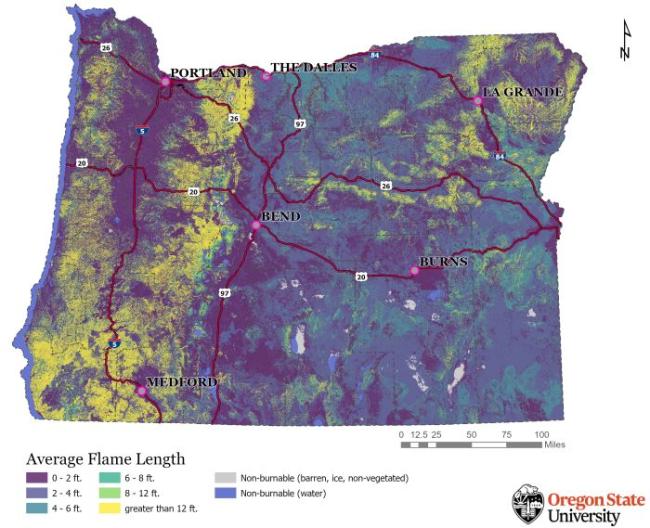
Fire intensity is represented as flame lengths. A range of fire intensity is possible at any location because fires can coincide with a variety of weather conditions which might either exacerbate or mitigate fire intensity. In this map, fire intensity is classified into six fire intensity levels based on the weighted average fire intensity from a model that ran over 200 different weather scenarios.
Hazard Classifications
Scientists used data from the wildfire hazard models to assign a hazard classification to every property in Oregon. Data values were calculated at very fine scales and then averaged across each tax lot. Each lot was then assigned to one of three hazard zones: low, moderate or high.
Many factors contribute to a property’s hazard zone classification. Some of those factors are visible just by looking at a property – for instance, the amount and type of vegetation which primarily affect fire intensity. Other factors can’t be determined by looks alone. For instance, it is impossible to see the likelihood of experiencing a fire or the effect that regional climate patterns may have on a location’s burn probability.
High Hazard Property
Landscape conditions
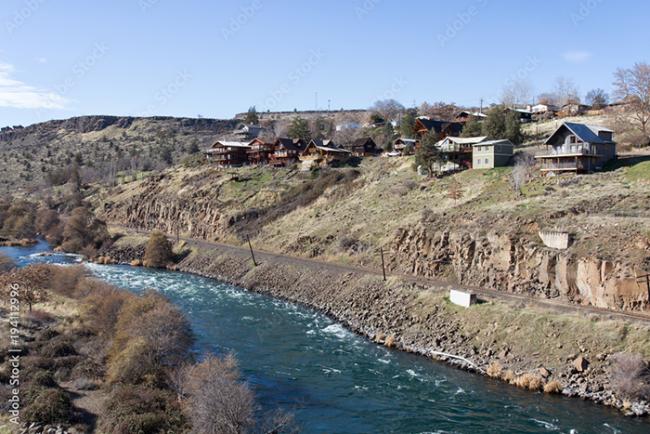
In some cases, the factors contributing to high hazard are not visible from the property itself. For example, burn probability is the result of spatial ignition patterns and landscape-level interactions between climate and vegetation. Some properties will have high hazard because they are situated in frequent fire landscapes, regardless of the average fire intensity.
High Hazard Property
Local Conditions
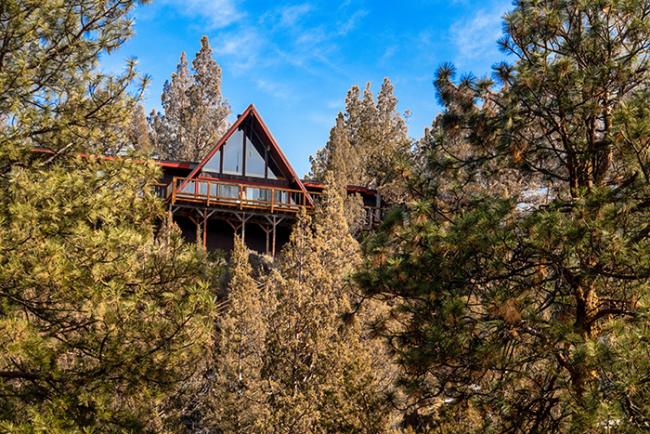
In some cases, the factors contributing to high hazard conditions might be visible in local characteristics. If the property and adjacent areas are comprised of highly flammable fuels, then the property will be exposed to greater average flame lengths and, as a result, might have relatively high hazard, Likewise, when properties contain or are surrounded by large blocks of contiguous flammable vegetation, it facilitates fire spread and increases burn probability.
What Is the Wildland-Urban Interface (WUI) and How Was It Mapped?
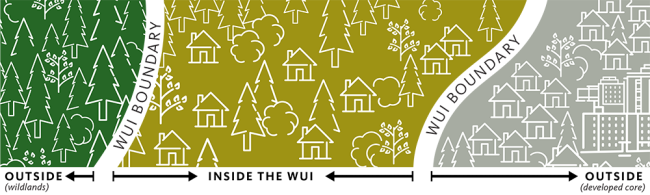
The wildland-urban interface (WUI) is the geographic area where structures and other human development meet or intermingle with forests, rangelands and other vegetation.
Although wildfire disasters happen across a broad range of communities from rural to urban, research shows that most community wildfire disasters in the U.S. have occurred in the WUI. In some communities, the WUI is a transition zone between the more urban core and the wildlands. In these cases, structures in the WUI are threatened by fires spreading into communities, often via ember showers. In other areas, the WUI includes development intermixed with wildland vegetation such that communities are more directly exposed to flames when fires occur. In both cases, the WUI captures areas where there is enough wildland vegetation to support a wildfire AND enough development to result in significant damage to homes, critical infrastructure and human lives.
Researchers at OSU mapped the WUI by applying the best available science and data to a set of definitions and rules developed by a diverse committee of stakeholders. First, in order to be in the WUI, there must be at least one structure per forty acres. Importantly, the rules also make some accommodations. For example, a collection of buildings (e.g., barns and garages) on a single property cannot constitute their own WUI just because there are enough buildings. Second, for areas that do have one structure per forty acres to be included in the WUI, they must also be surrounded by flammable vegetation or located within 1.5 miles of a large patch of flammable vegetation.
The WUI can be mapped in different ways. In Oregon, there are legal criteria for defining the WUI. To map the WUI for the statewide wildfire hazard map, OSU scientists applied the best available science and WUI definitions in OAR 629-044-1011.
How Will the Wildfire Hazard and WUI Maps Be Used?
In accordance with Oregon law, the statewide hazard map and the WUI map are designed to be used together to help state agencies prioritize the communities with the highest need for hazard mitigation. To do that, agencies will use both maps to identify properties that are in the WUI and classified as high hazard. This will allow them to allocate state and federal funds to the areas with most need and determine where defensible space and/or fire hardening codes might apply.
Only properties meeting both criteria are potentially subject to defensible space and fire hardening rules required by state law. Fire hardening rules will not apply to existing structures unless significant home updates occur. The codes for both defensible space and fire hardening are currently in draft form and are not adopted for enforcement.
The maps will also help agencies, communities and individuals across Oregon better understand their hazard and prepare for future wildfires. The data and maps are available on the Oregon Explorer.
How and when will I know the wildfire hazard classification of my property?
Beginning Jan. 7, 2025, the Oregon Department of Forestry will mail notifications to property owners whose land falls within both the high hazard category and the wildland-urban interface (WUI).
The statewide wildfire hazard and WUI maps are also publicly available on the Oregon Explorer for property owners and communities to learn about and plan for their wildfire hazard. Oregon Explorer serves as an interactive educational tool for Oregonians. Since 2007, the Oregon Explorer, a program of the Institute of Natural Resources at OSU, has been a public source of geospatial data and wildfire risk information used in state, regional and local risk management applications.
If property owners believe that their wildfire hazard has been mischaracterized, they can appeal the decision through the Oregon Department of Forestry. Visit their website to learn more.
Questions?
To assist with questions about the hazard map designations and what it means to property owners, ODF has opened a call center to address commonly asked questions. This support line is just for questions on the hazard map and will be staffed Monday through Saturday from 6:30 a.m. to 3 p.m. PST from Jan. 7 until mid-March.
Please call 1-844-996-2259 for assistance on the hazard maps. If you have more detailed questions, please email them to hazardmap@odf.oregon.gov.